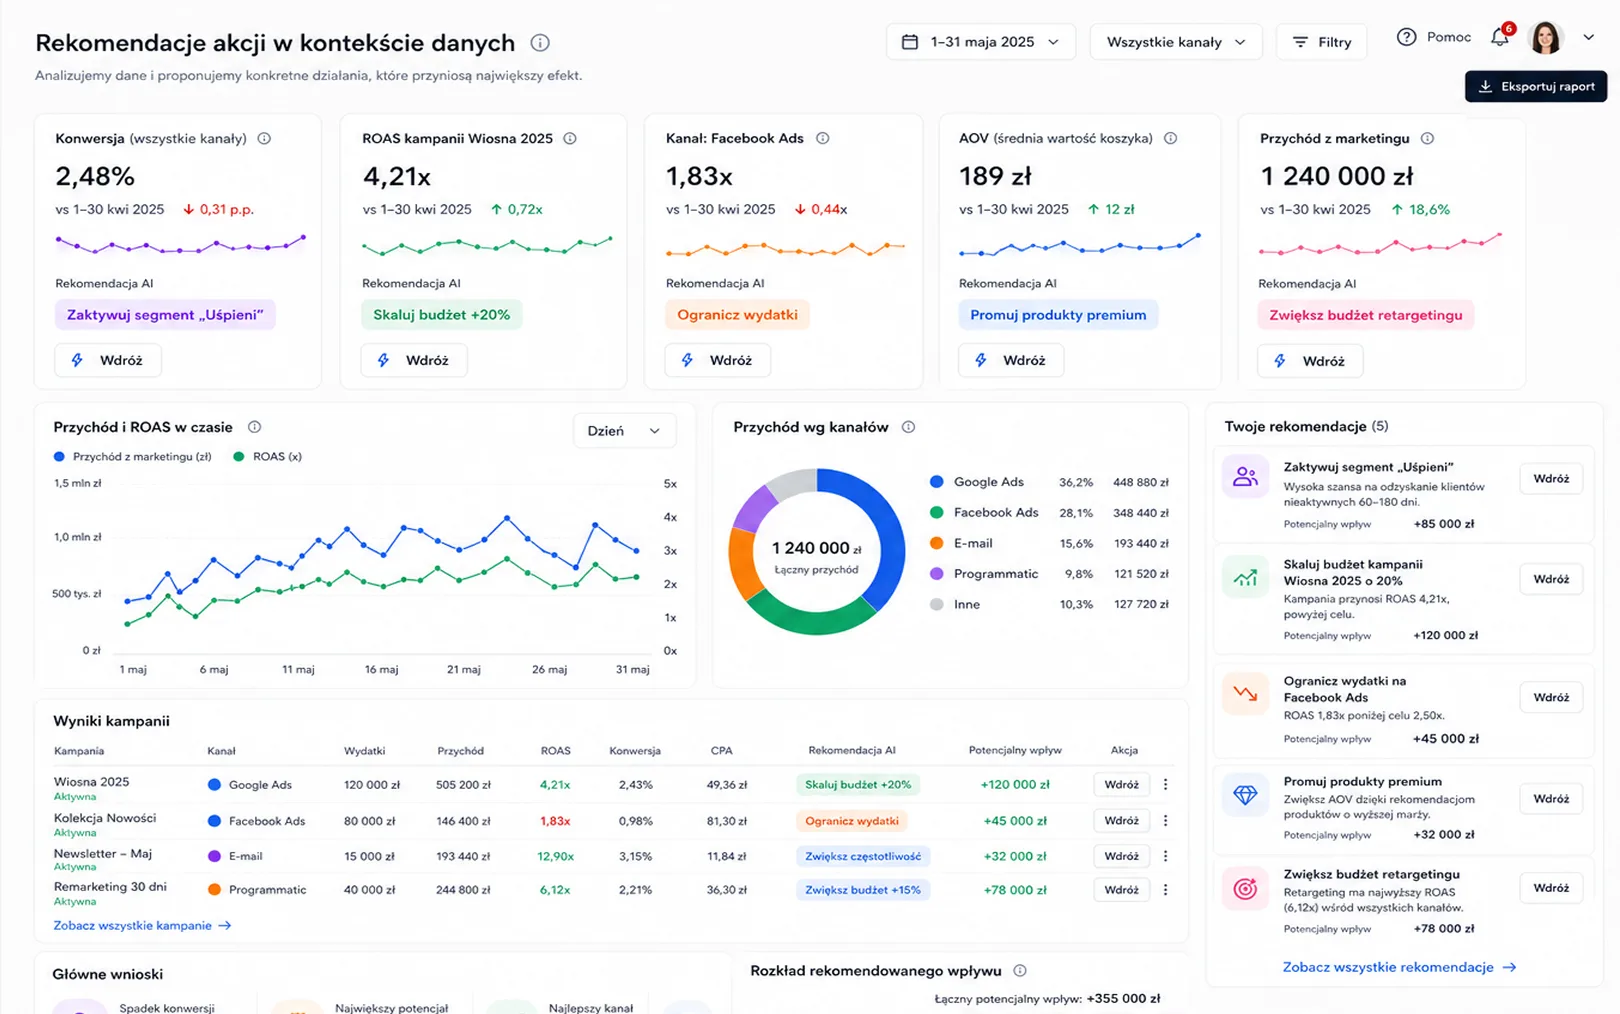
Dashboards that don't just show numbers but lead to decisions.
Dashboards that don't just show numbers but lead to decisions - with the ability to drill down to a single customer and suggestions for concrete actions.
Drill-down to the level of a single customerAutomated anomaly alertsShorter time from data to decision
Starting point
Why aren't classic reports enough?
Static reports show what happened, but they don't answer the questions „why” and „what now”. Our actionable dashboards combine a top-level view with the ability to drill down into every metric and suggest the next step - instead of leaving you with a table of numbers.
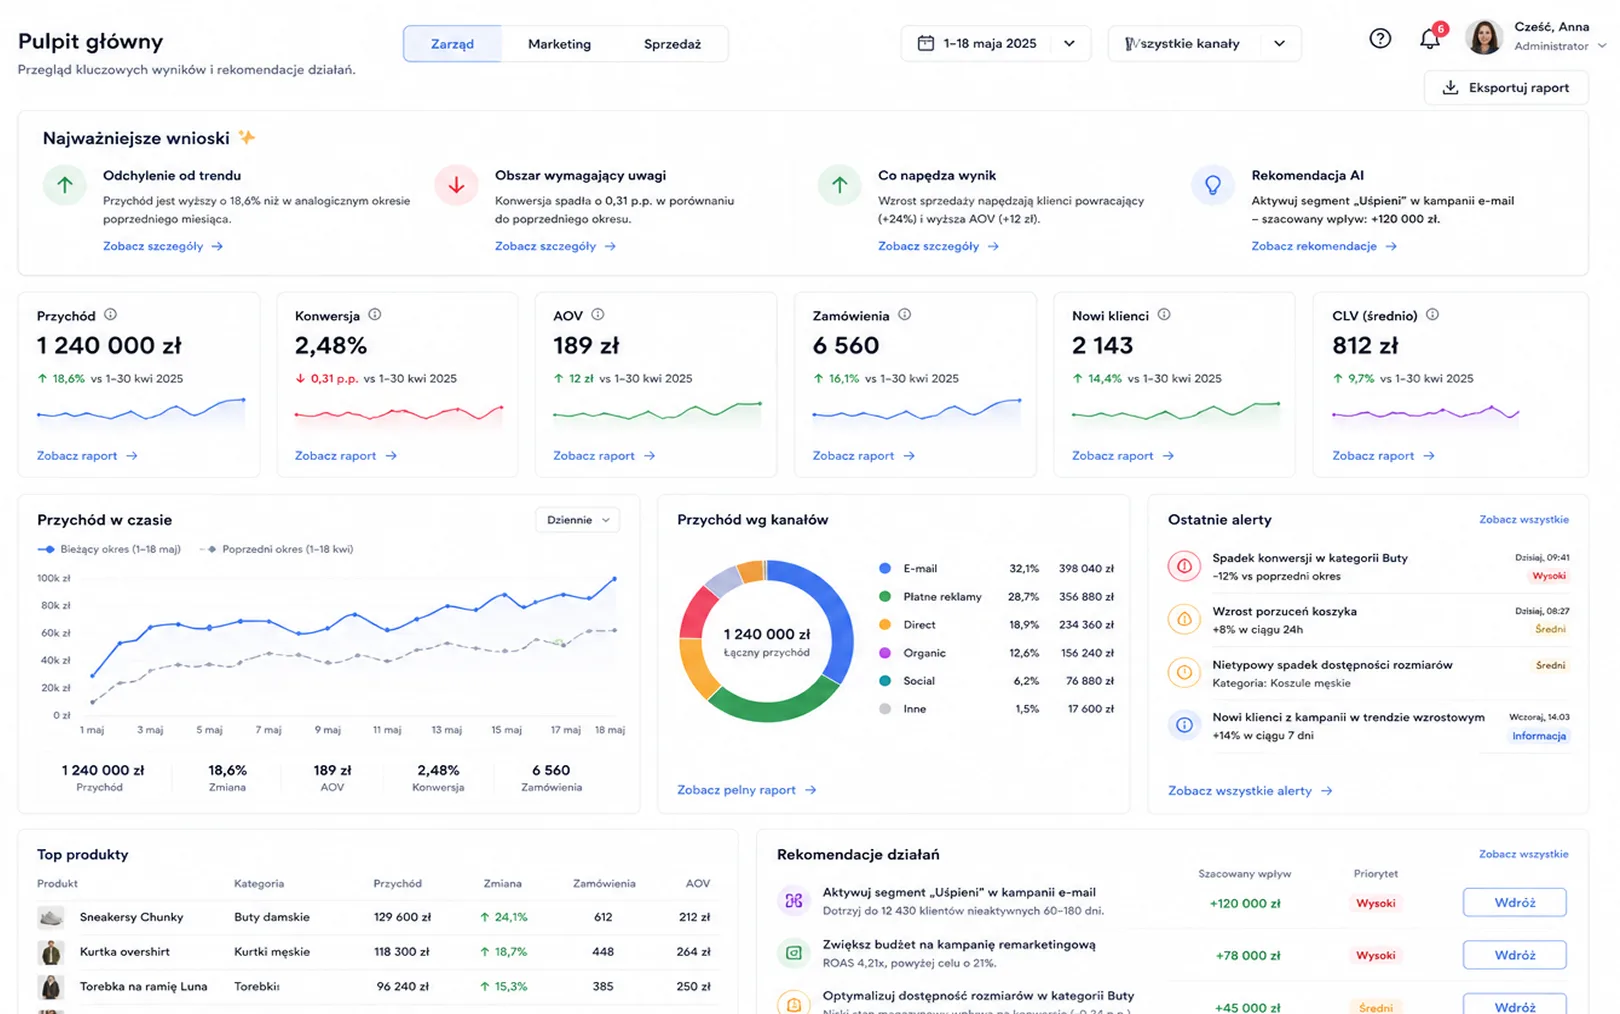
In the top-level view we deliver key business insights ready to act on.
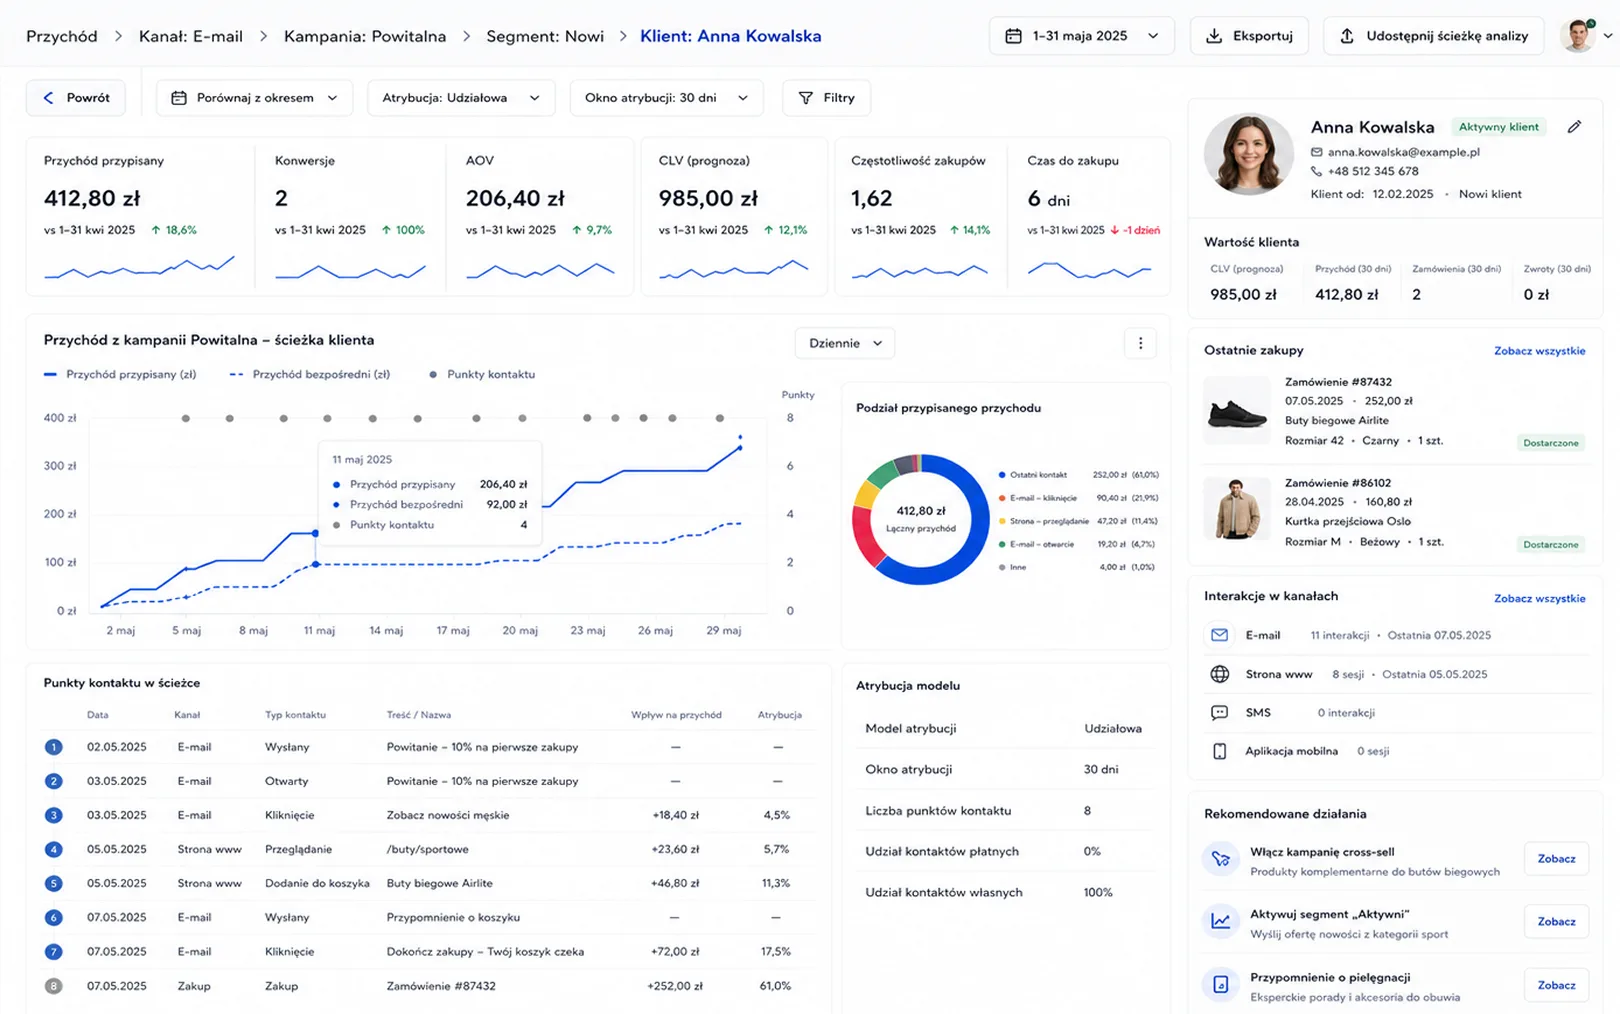
We enable drill down from the KPI level all the way to a single segment, campaign or customer.
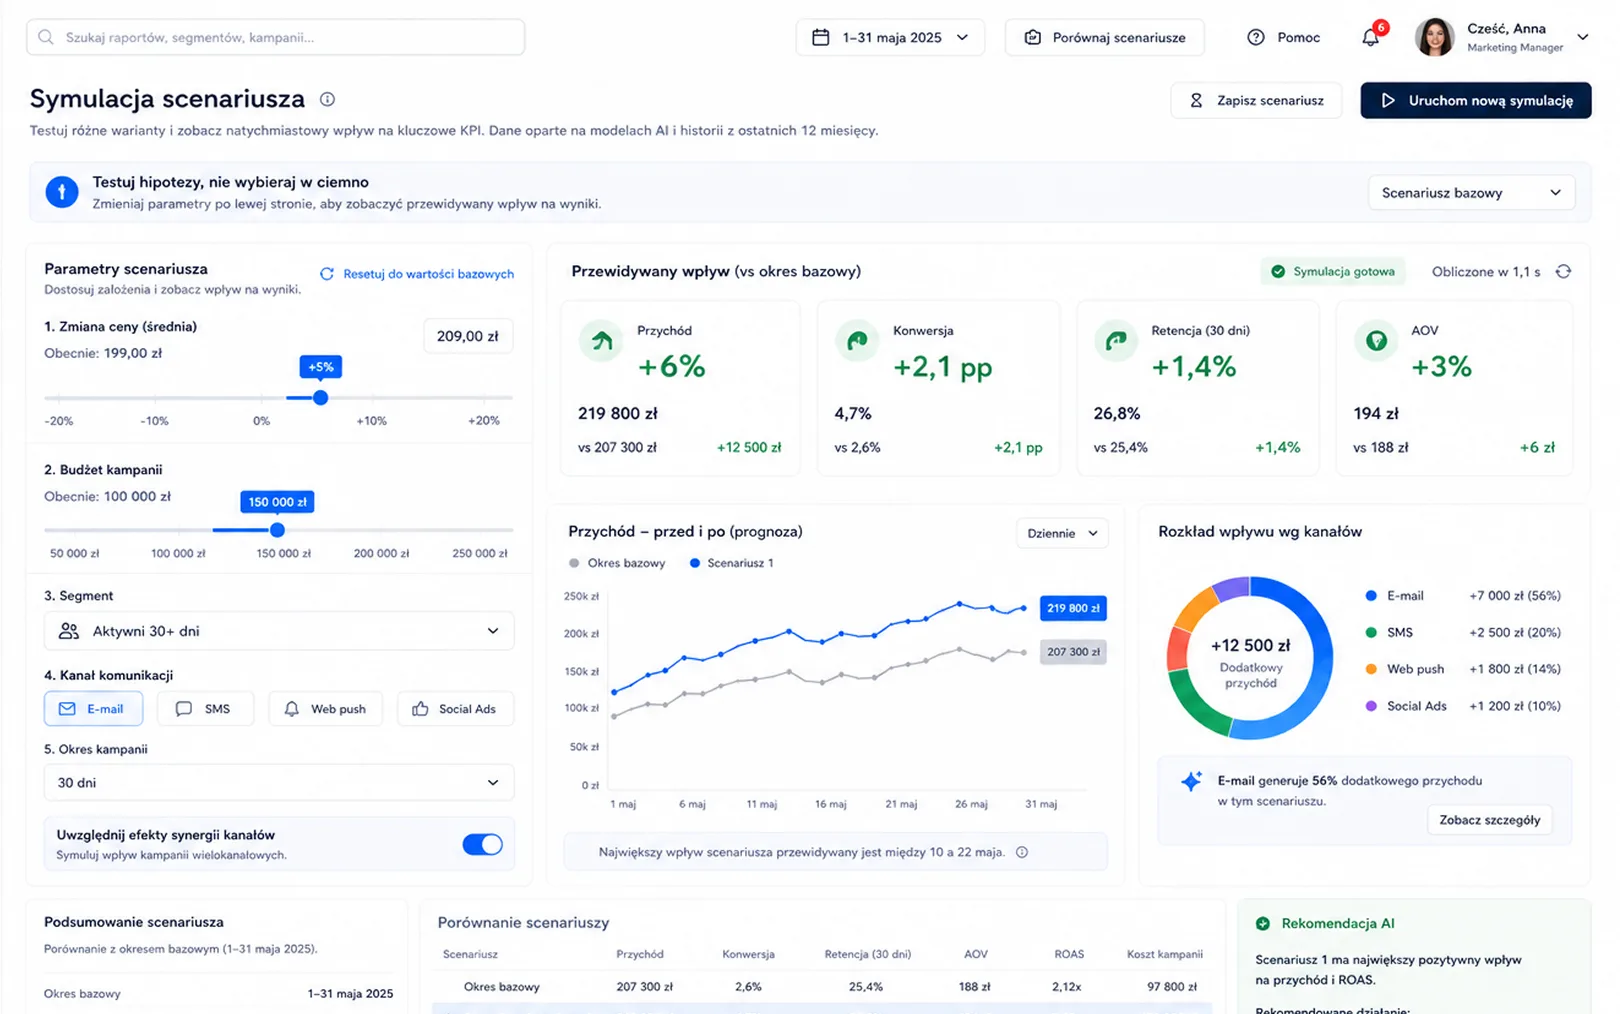
We support quickly assessing, predicting and adapting business scenarios.
01
Business insights in the top-level view
Every dashboard opens with a ready-made summary of the most important conclusions - you don't have to interpret raw numbers.
We show deviations from the trend, flag areas that require attention and indicate what is driving the result. The board, marketing and sales receive the same layer of context, tailored to their role.
Business value: faster understanding of the situation, shorter time from data to decision, lower risk of overlooking significant changes
02
Drill down to the level of a single customer
Every metric is clickable.
From an aggregated KPI you descend to the channel, campaign, segment, all the way to a single customer - without switching between tools and without waiting for a team of analysts. The entire analysis path is preserved, so you can return to the starting point or share it with your team.
Business value: full control over the analysis, faster identification of the sources of problems, less dependence on the data department
03
Business simulations and scenarios
Check „what happens if...” without risking your budget.
Dashboards let you model changes in prices, campaigns, segments or channels and immediately see the estimated impact on revenue, conversion and retention. Decisions stop being a shot in the dark - they become hypothesis testing.
Business value: lower risk of strategic decisions, better budget allocation, faster testing of business hypotheses
04
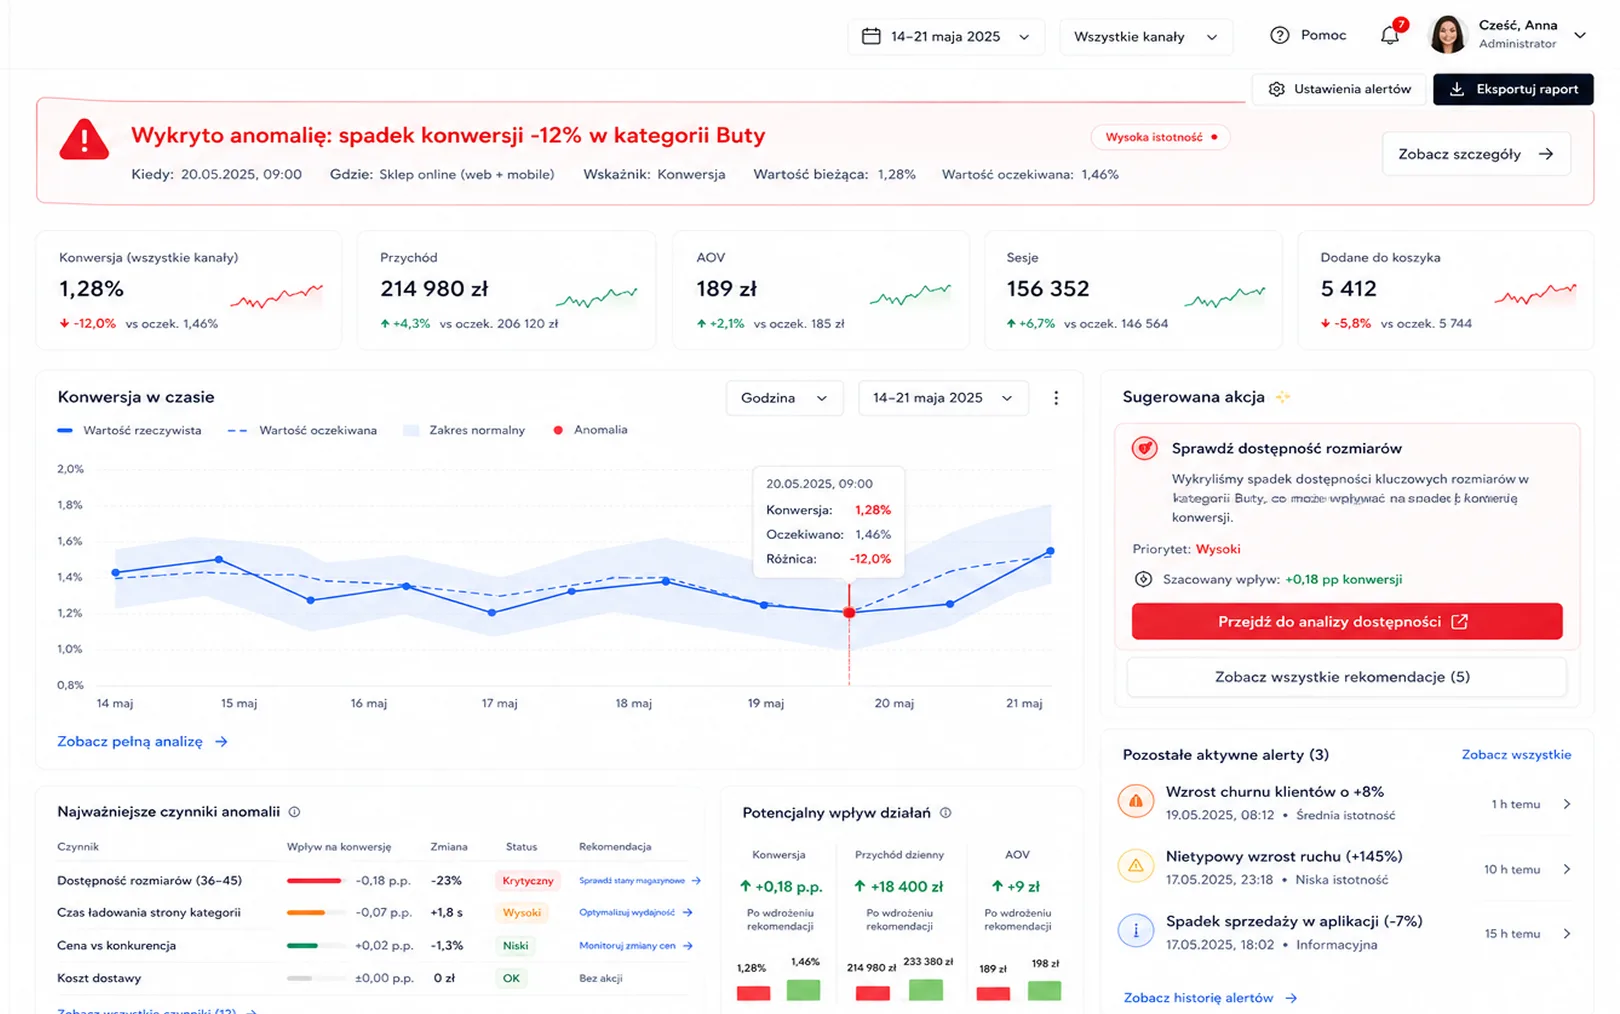
Alerts and anomaly detection
The system monitors metrics on its own and warns you when something deviates from the norm - a drop in conversion, a rise in churn, unusual traffic in a segment.
Instead of discovering the problem at the end of the month, you find out about it while you can still react. Every alert comes with context and a suggested action.
Business value: faster reaction to performance drops, earlier detection of opportunities, fewer losses hidden in the data
05
Action recommendations in the context of data
At every KPI we suggest a concrete, ready-to-implement action - a segment to activate, a campaign to scale, a channel to cut back.
The recommendations are based on behavioral data and historical effectiveness, so the dashboard becomes a starting point for execution rather than the end of the analysis.
Business value: a shorter path from insight to execution, greater effectiveness of marketing activities, consistency of decisions across the team
06
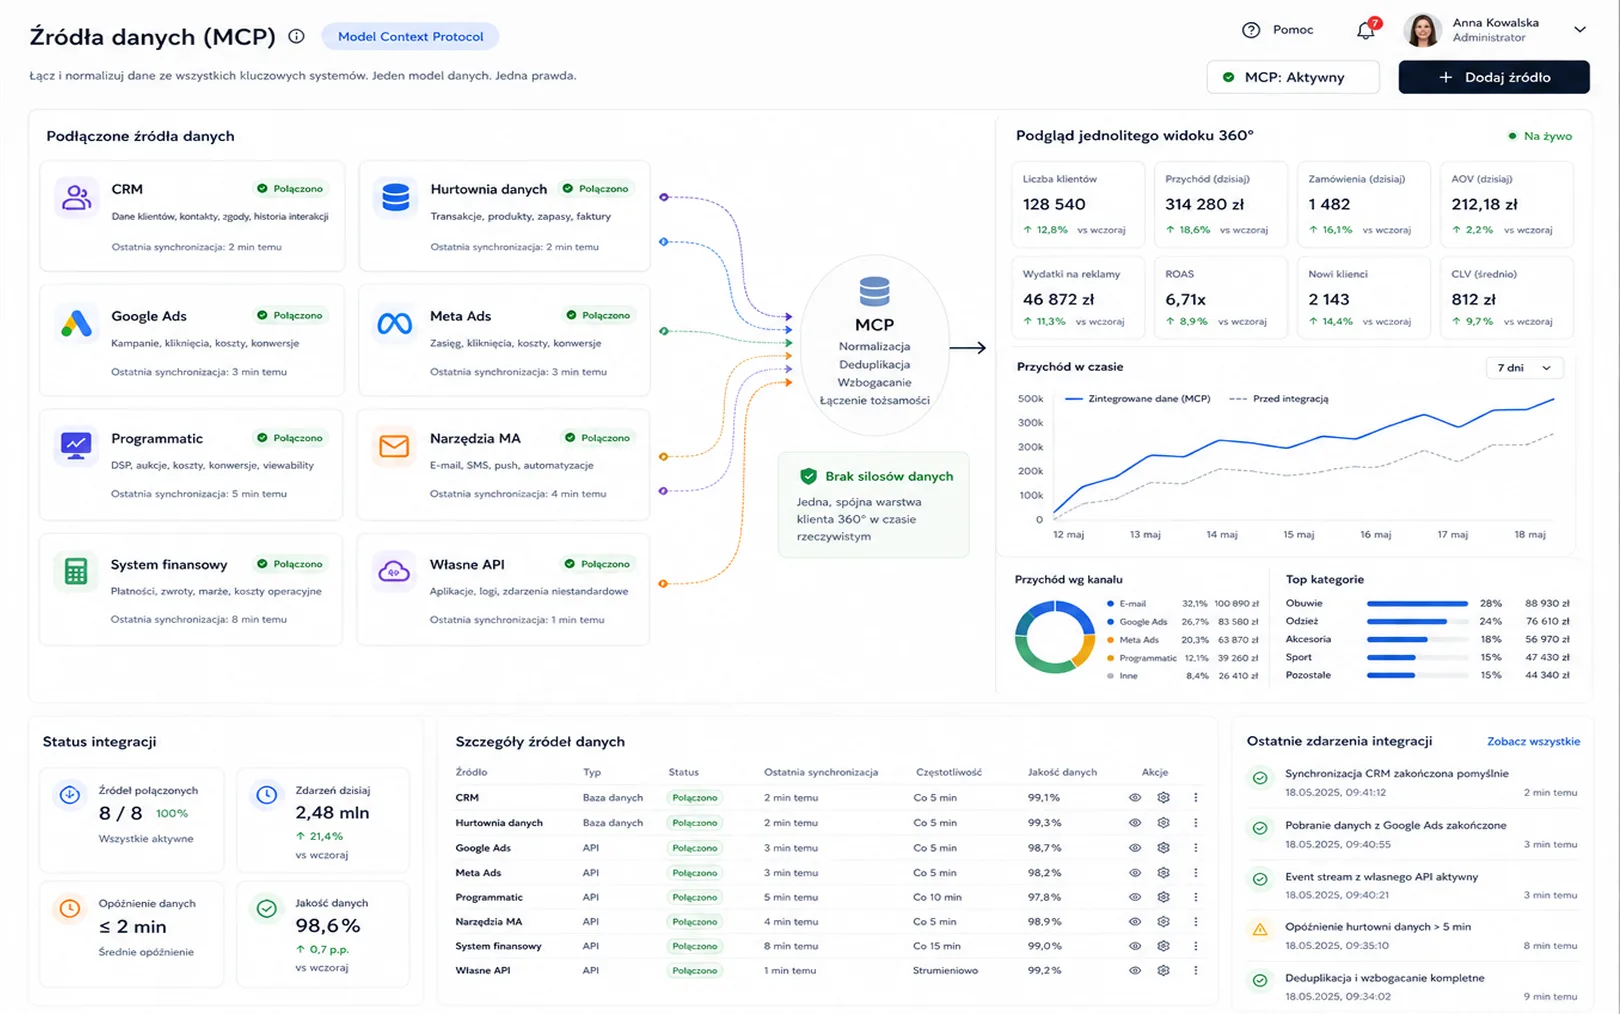
Connecting data from external sources via MCP
A dashboard doesn't have to be limited to a single system.
Thanks to support for the MCP protocol (Model Context Protocol) you connect any external data sources - CRM, a data warehouse, advertising systems (Google Ads, Meta Ads, programmatic campaigns), marketing automation tools, financial systems or your own APIs - and analyze them in a single view. Data from different systems becomes comparable, and insights take into account the full business context, not just a fragment.
Business value: a more complete picture of the business in one place, no data silos, faster onboarding of new sources without costly integrations
Blog
Latest articles
Knowledge and practical tips on Synerise, AI and personalization.
E-commerce growth calculators: CLV, churn cost, loyalty program
Three free, interactive Persooa calculators: compute Customer Lifetime Value (CLV), the annual cost of churn and the ROI of a loyalty program for your e-commerce.
Synerise vs MarTech - how the platform differs from others on the market
A comparison of Synerise with the largest MarTech platforms. A proprietary foundation model trained on behavioral data, the TerrariumDB database, 31 billion events per month and 50 features you won't find at the competition.