

In this article, we'll show you how to build a scalable personalization structure - the same one used by leading brands to secure long-term, business-critical results.
Every business has its own workflow and methods for "delivering" projects and personalization activities. Some specialists, more experienced in the field of personalization, may follow strictly defined processes, while others prefer to experiment and work more flexibly.
If, however, you want to ensure long-term, scalable growth for your brand, you'll need to complete a series of extremely important steps. You can effectively achieve your personalization goals by following a specific structure developed by the best in the field.
Table of contents
- 01 What does a practical personalization structure look like?
- 02 What might a sample personalization strategy look like?
- 03 How to create personalization step by step?
- 04 Summary
01 What does a practical personalization structure look like?
The structure comprises six stages, and each of them defines specific steps to complete:
| Stage | Step and description |
|---|---|
| Analysis | Insight - insights generated from data |
| Brainstorming | Idea - proposing solutions based on key insights |
| Definition | Hypothesis and goal - expected results based on defined use cases; goals and KPIs based on business needs |
| Planning | Prioritization - assigning appropriate weight to experiments aligned with the established testing plan. Definition - testing parameters and conditions created based on KPIs, strategy, targeting, segmentation, and the duration of a specific campaign/A/B test |
| Execution | Delivery - developing the intended user experiences based on the best practices used in your industry with regard to visual and technical requirements. Quality control and implementation - determining whether the experience meets the requirements set during delivery; rolling out the experience after business and technical approval |
| Optimization | Validation - measuring the results obtained after reaching significance level. Optimization and testing - updating use cases based on quantitative and qualitative evidence; implementing new use cases after analyzing insights and results from previous activities |
Each stage defines steps that your team must complete for the personalization project to achieve its intended goals. Your team should have the knowledge and skills necessary to complete every stage. Now let's see what all of this might look like in practice.
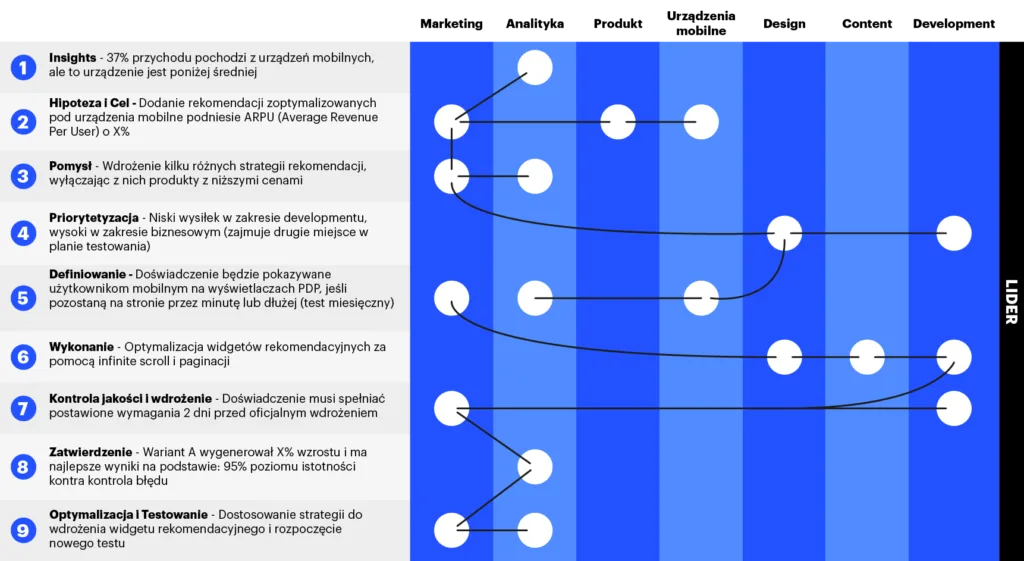
02 What might a sample personalization strategy look like?
There are many examples of personalization, but in this case we can define the team leader as a person closely connected to the entire process. They may be directly involved in activities at every stage, from idea through planning to execution, or peripherally, providing support or guidance when needed.
What's more, at those stages where more than one person is responsible for key activities, each of them can take on the role of coordinator, pushing the project forward. If responsibilities are clearly assigned, the transition from one stage to the next should proceed seamlessly.
This breakdown should serve as the basic structure for any organization - it can, of course, be adjusted and improved (and this will happen naturally, as work progresses), but since each stage has a different purpose, the integrity of the process structure should not be arbitrarily skipped.
03 How to create personalization step by step?
We can make the first attempt to implement a new process once the key specialists are fully aware of their roles and the workflow structure.
1. Analyze your data to gain valuable insights and opportunities
Goal: Optimization and Analytics
Companies may indeed have similar goals, e.g. increasing revenue, but not all use cases are equal. Some ideas will work for, say, a specific category for a given audience, while others won't. That's why, if you want to make truly informed decisions about your personalization strategy, a detailed analysis of the data you have is essential - and often you'll need to expand that data to a more granular level.
As a good starting point, it's worth identifying errors occurring in your site analytics. Look, for example, for sources of high traffic volume combined with poor site performance. This way you'll pinpoint the areas that require improvement.
Pay particular attention to the following trends:
- High bounce rate/exit rate on product pages or the cart page
- Low web session value on mobile devices
- Low session value for a specific age group or gender
- Low session value on weekends or evenings
Companies can also take an audience-first approach, using segments that impact the user experience. For example, when analyzing site traffic you may find that a large portion of visitors come from one specific source or a particular demographic group.
CX (Customer Experience) can be influenced by segments such as:
- Gender
- Product category
- Location
- Traffic source
- Price ranges
- Price sensitivity
- Brand loyalty
It's definitely worth leveraging the opportunities offered by segments and site performance and incorporating them into your strategy.
2. Brainstorm
Goal: Universal
Introduce an interdisciplinary, team-based approach - encourage knowledge sharing by welcoming ideas from all key specialists, and you'll never run out of ideas for A/B tests. Use the insights gathered in the previous stage and consider new testing options during regularly held brainstorming sessions.
Start by creating a list of all the categories you can test. Then combine them with all the types of tests you can run.
Categories may include the following:
- Banners
- Content
- Layout
- Promotions
- Overlays
- Newsletters
- Push notifications
- Notifications
- Recommendations
Your specialists should focus on why a given test is specifically worth running and what its long-term results and opportunities will be.
3. Define a hypothesis and select KPIs for each idea
Goal: Marketing and Merchandising + Optimization and Analytics
Now it gets interesting - we'll now hypothesize about changes to the site that could prompt the user to take the actions we want. It's worth starting with this line of thinking:
Based on [OBSERVATION], I believe that if we implement [PROPOSED CHANGE], we will observe an increase in [SPECIFIC TEST METRICS].
These frameworks, however, should not be confused with facts. They are rather well-reasoned ideas, based on data analysis and earlier observations. They serve as the starting point for the optimization process itself.
In your hypotheses, be guided by the question "why", business goals, and valuable online actions. It's important for your team to discover what the desired outcome of each new experience is.
Proposed changes could include, for example:
- Introducing social proof on mobile/desktop devices
- Personalizing hero banners on the homepage
- Implementing exit pop-ups
- Enabling notifications about the amount remaining until free shipping
Metrics could include:
- Conversion rate
- Average order value (AOV)
- Average revenue per user
- Monthly revenue
- Click-through rate (CTR)
With such a list, ideas can later be evaluated for inclusion in the testing plan.
4. Determine which test ideas should be prioritized
Goal: Universal
In all this frenzy of brainstorming and hypotheses, it's easy to get carried away. But as with any project, it's crucial to consider the impact and effort our activities will involve. Otherwise, our valuable time and energy may be wasted on campaigns that are either unrealistic or offer little to no value for the company.
Impact (may be classified as very high, high, or medium):
- Alignment with company goals
- Estimated time to impact
- Impact on the purchase funnel
- Potential to reduce costs
Effort (may be classified as very high, high, or medium):
- Number of teams involved
- Level of code or test complexity
- Test alignment
- Time spent on quality control
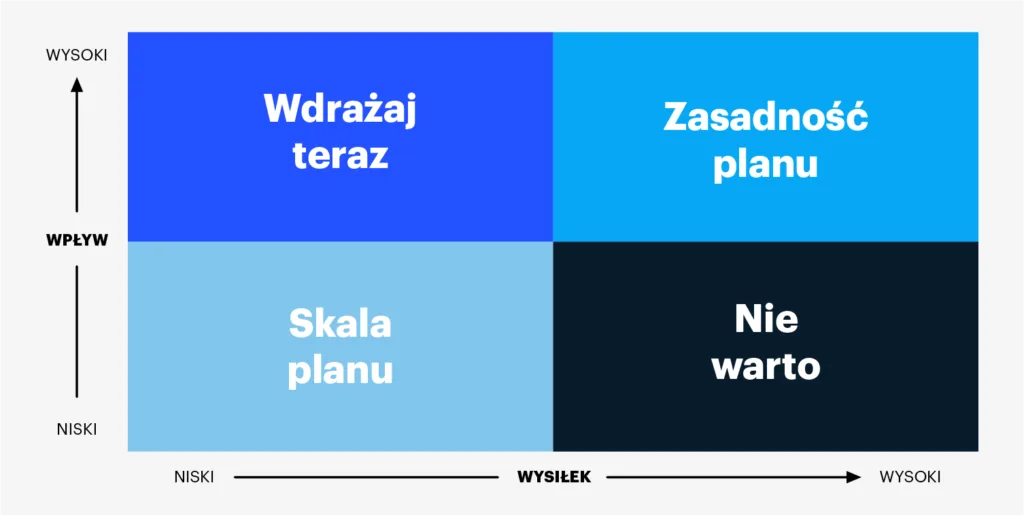
After assessing all the factors, plot each campaign idea on a chart. For example, a high-impact, low-effort personalization campaign might use social proof showing the number of views, add-to-cart actions, or purchases of a specific product.
You can adopt the following "actions" as a template:
- High impact + Low effort = Can be implemented immediately
- High impact + High effort = Long-term plan
- Low impact + Low effort = Quick, marginal gains
- Low impact + High effort = Not worth it!
Setting priorities for testing is the key to reducing the time spent on design and development, and consequently to fast and effective campaign delivery.
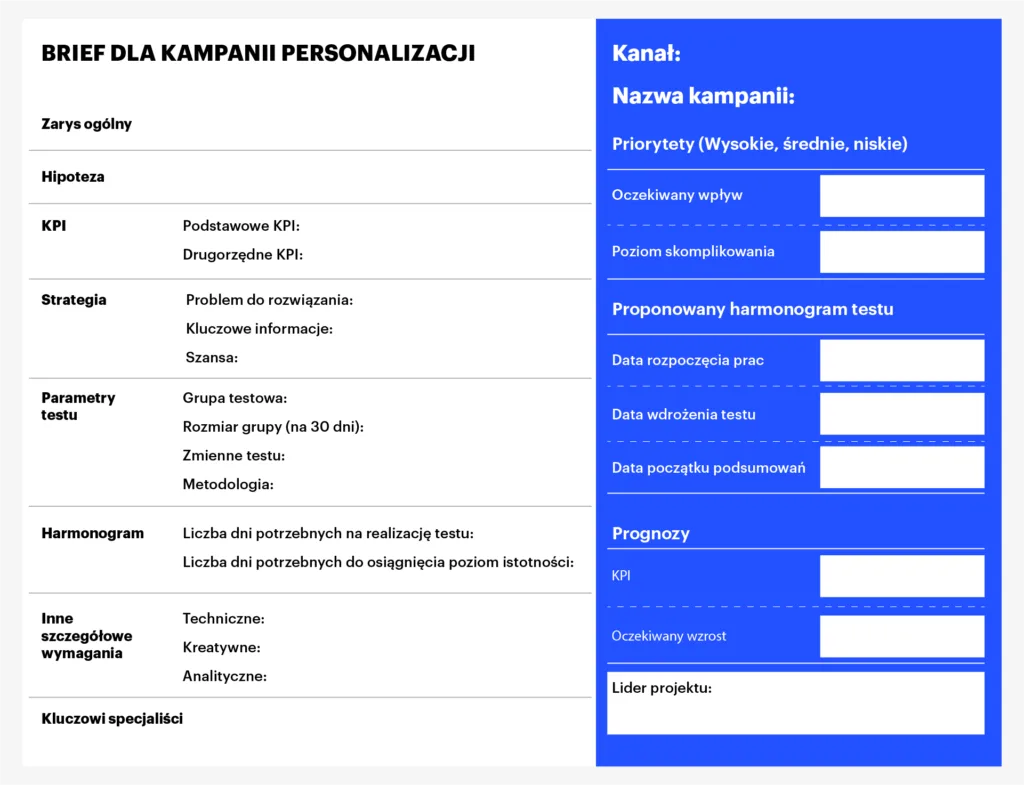
Once you've compiled a list of validated ideas, each campaign must be defined in a brief. The information developed in the previous stages will be useful for creating it. You'll also need important implementation details, such as test parameters, audience, schedule, etc. All key specialists should be involved in creating the brief, because they are the ones who will later use it as a reference point for everything related to project delivery.
5. Delivering and implementing new user experiences
Goal: Universal
Time for teamwork - all specialists must collaborate with one another to achieve the intended result. Usually, the following workflow is adopted to create the first version:
- We create the copy and CTA (Marketing and Merchandising)
- We develop the mockups and overall design (Product)
- We build the specifications (Development)
After delivery, the finished experience will undergo a detailed review so that specialists can make sure it meets all the agreed requirements. During the evaluation:
- Step 4: We note any deviations from functionality (Marketing and Merchandising)
- Step 5: We make any desired updates (Development)
- Step 6: We obtain approval for the final implementation (Project Leader)
Of course, further quality checks may also be necessary. You'll find more on testing itself in our guide to A/B tests and their optimization.
6. Evaluation and optimization
Goal: Optimization and Analytics
Every project must be carefully monitored, analyzed, and optimized for performance. We can only get to this, however, once the test first reaches significance level.
The time it takes for an experience to achieve meaningful results will vary depending on its format, sample size (number of users), and number of variants. We recommend, however, waiting at least two weeks.
When analyzing and optimizing, take the following variables into account:
- Baseline conversion rate - i.e. the current conversion rate (the number of desired actions divided by the number of visitors, sessions, or views) for the experience being tested.
- Expected increase in conversion rate - the projected percentage change in conversion rate relative to the baseline. For example, if the baseline conversion rate is 2.5% and we expect an increase of 5%, the new conversion rate should be 2.625%.
- Number of variants - all variants compared in a single test.
- Average sample size per day - the number of visitors who will encounter the experience within a single day.
After the test officially concludes, gather all the valuable insights and data to better understand the reasons behind the results for each user segment. You should use the collected information to further build various personas and audiences, optimize ongoing campaigns, and introduce entirely new tests. You'll find more in the article on how to increase sales and the conversion rate of your online store.
04 Summary
Personalization activities are cyclical. This means that after completing one test, companies return to the beginning of the entire structure, where they once again start analyzing the data they've gathered, brainstorming additional ideas, forming hypotheses about new or improved changes, and so on.
Every time the team goes through the successive stages of creating a new experience, the entire workflow and processes become more efficient, forming a well-oiled machine that delivers scalable and effective personalization results for the whole company.